


Early Days
The Walt Disney Company was founded on October 16, 1923, in Los Angeles, California. The company began as the Disney Brothers Studio, created by Walt Disney and his brother Roy O. Disney.
Walt Disney's vision was to create timeless entertainment that would bring joy and inspiration to people of all ages. The core focus has always been on high-quality storytelling, innovation in animation and technology, and creating immersive experiences.
Walt Disney had a passion for animation and storytelling. His brother Roy, who had a keen business sense, managed the finances. Walt's innovative ideas and artistic talent, combined with Roy’s business acumen, laid the foundation for the company. The initial funding came from their combined savings and a $500 loan from Roy's uncle.
At its inception, the company had modest assets: a rented office space in the back of a real estate office, a borrowed camera, and a small team of animators, including Walt himself. Their first major project was a series of animated shorts featuring a character named Oswald the Lucky Rabbit. However, a contractual dispute led to the loss of Oswald to Universal, which prompted Walt to create a new character—Mickey Mouse. Since then Disney has established a tighter control over its creations and entered into better-negotiated contracts. The creation of Mickey Mouse, a character they fully owned, symbolized this new approach.
Challenges and Breakthrough
The first few years, the company faced numerous challenges and financial difficulties. The animated short "Steamboat Willie," featuring Mickey Mouse, premiered in 1928 and was one of the first cartoons with synchronized sound. Its success marked a turning point, but profitability remained a struggle until the early 1930s.
The release of "Snow White and the Seven Dwarfs" in 1937, the first full-length animated feature film, was a significant breakthrough, grossing $8 million during its initial release—a record for the time.
Becoming a Phenomenon
Disney truly became a phenomenon with the opening of Disneyland in Anaheim, California, in 1955. The park was an immediate success and represented Walt's vision of a place where both children and adults could have fun together. This success was followed by the creation of Disney World in Florida in 1971, which further cemented Disney's place as a cultural icon.
Initial Public Offering (IPO)
The Walt Disney Company went public on November 12, 1957. At the time of its IPO, Disney offered 600,000 shares at $13.88 per share. This pricing valued the company at approximately $8.3 million.
Current Market Capitalization
As of 2024, Disney's market capitalization is approximately $160 billion.
Current Share Ownership Breakdown
As of the most recent filings, here's a breakdown of share ownership in The Walt Disney Company:
Institutional Investors: large institutional investors and mutual funds own a significant portion of Disney's shares. Some of the largest institutional shareholders include:
The Vanguard Group: Approximately 7%
BlackRock: Approximately 6%
State Street Corporation: Approximately 4%
Individual Investors: individual shareholders, including retail investors, hold a substantial amount of Disney's stock, but their collective percentage is lower than institutional investors.
Company Insiders: includes shares owned by Disney's executives, board members, and other key insiders. While individual percentages vary, insider ownership is typically a small percentage of the total shares.
Others: various other investment entities, smaller funds, and miscellaneous shareholders.
Revenue Streams
Studio Entertainment - Disney's original business, started with animated films like "Snow White and the Seven Dwarfs" in 1937.
Theme Parks and Resorts - began with the opening of Disneyland in 1955.
Media Networks - initiated with the purchase of ABC in 1996, expanding through acquisitions and launches.
Consumer Products - officially formed as a division in 1987, although merchandising activities started earlier.
Interactive Media - launched in the early 2000s with video games and digital initiatives.
Streaming Services - Disney+ launched in 2019, followed by expanded offerings through Hulu and ESPN+.
As you already know, Disney's target customers are broad, encompassing children, families, and even adults who have grown up with Disney. The brand appeals to all age groups through its diverse range of films, TV shows, merchandise, and theme parks.
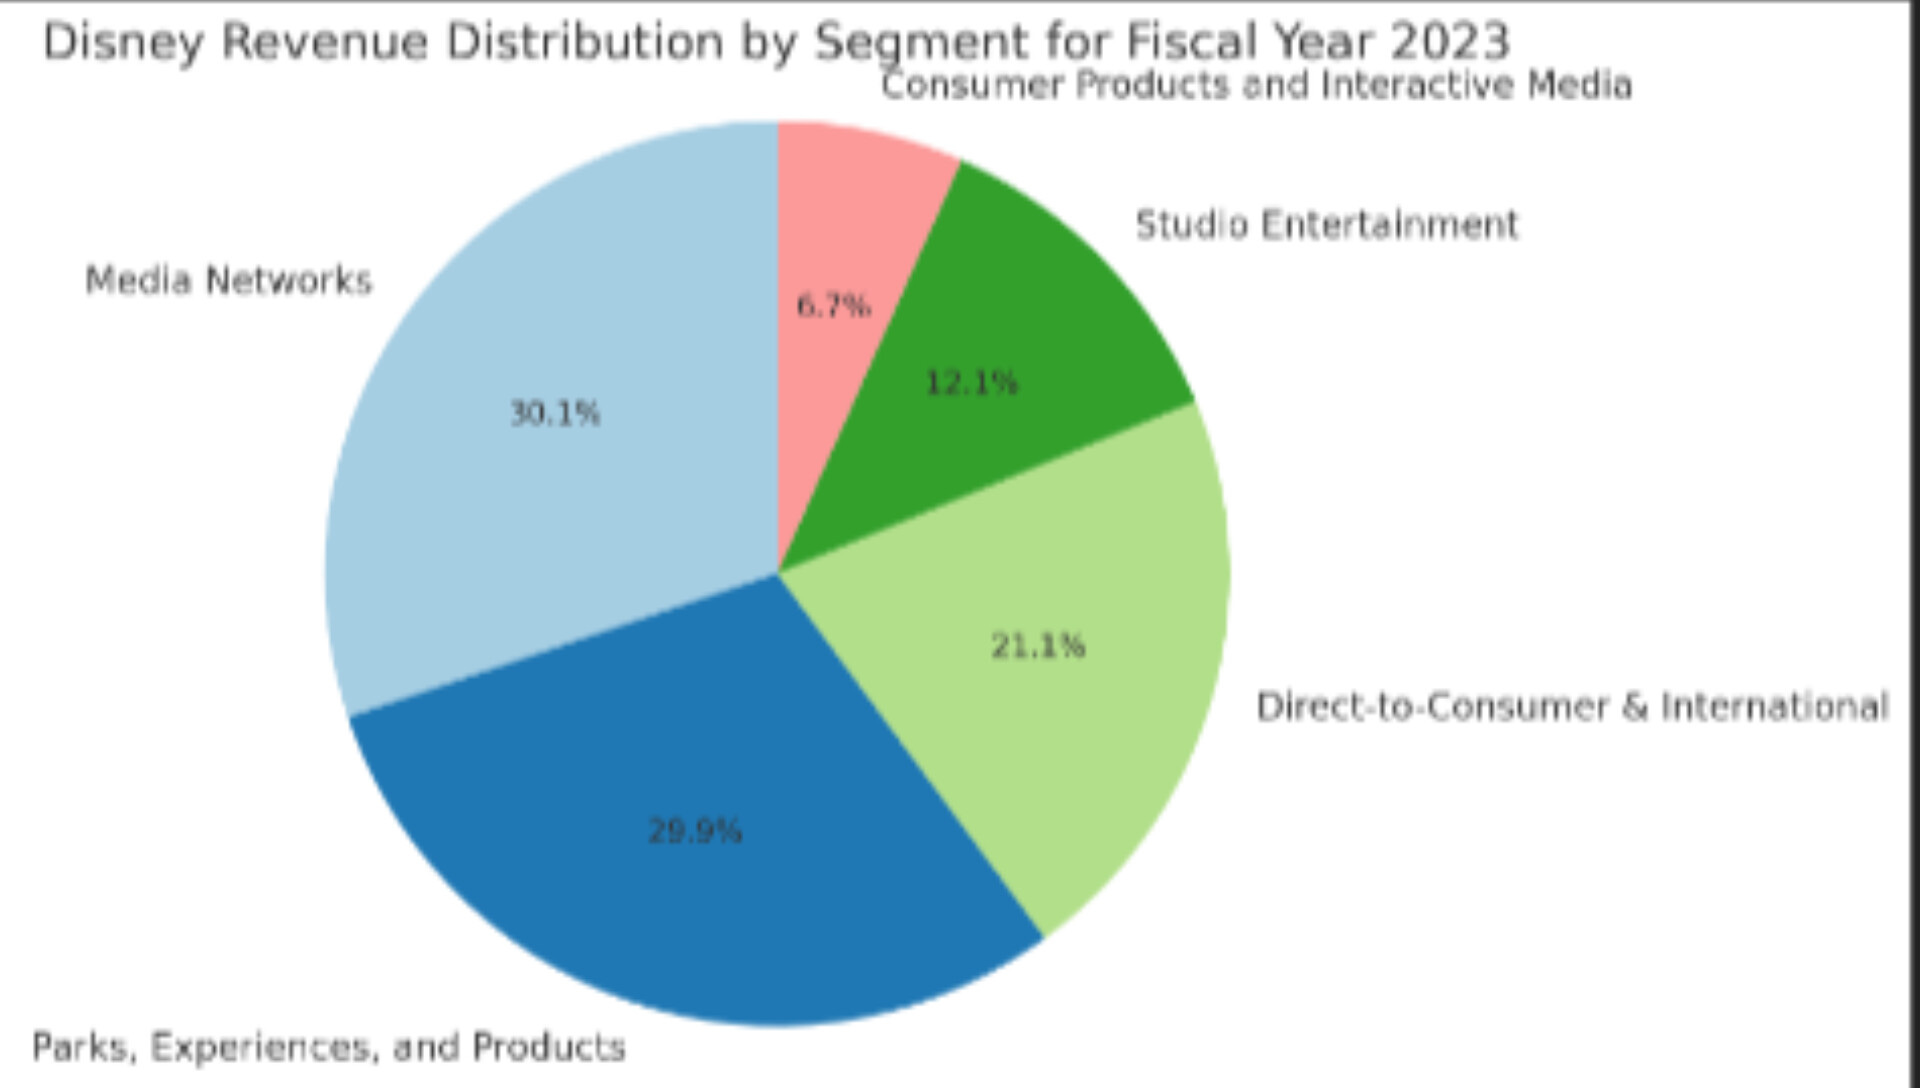
Revenue Generated By Segment (for the fiscal year 2023)
Media Networks: this segment, which includes cable and broadcast television networks, generated $28.4 billion (approximately 33.6% of total revenue)
Parks, Experiences, and Products: includes theme parks, resorts, and related products generated $28.2 billion (approximately 33.3% of total revenue)
Direct-to-Consumer & International: streaming services like Disney+, Hulu, and ESPN+ generated $19.9 billion (approximately 23.6% of total revenue)
Studio Entertainment: film production and distribution generated $11.4 billion (approximately 13.5% of total revenue)
Consumer Products and Interactive Media: includes merchandising and interactive media like video games and digital content which generated $6.3 billion (approximately 7.5% of total revenue)
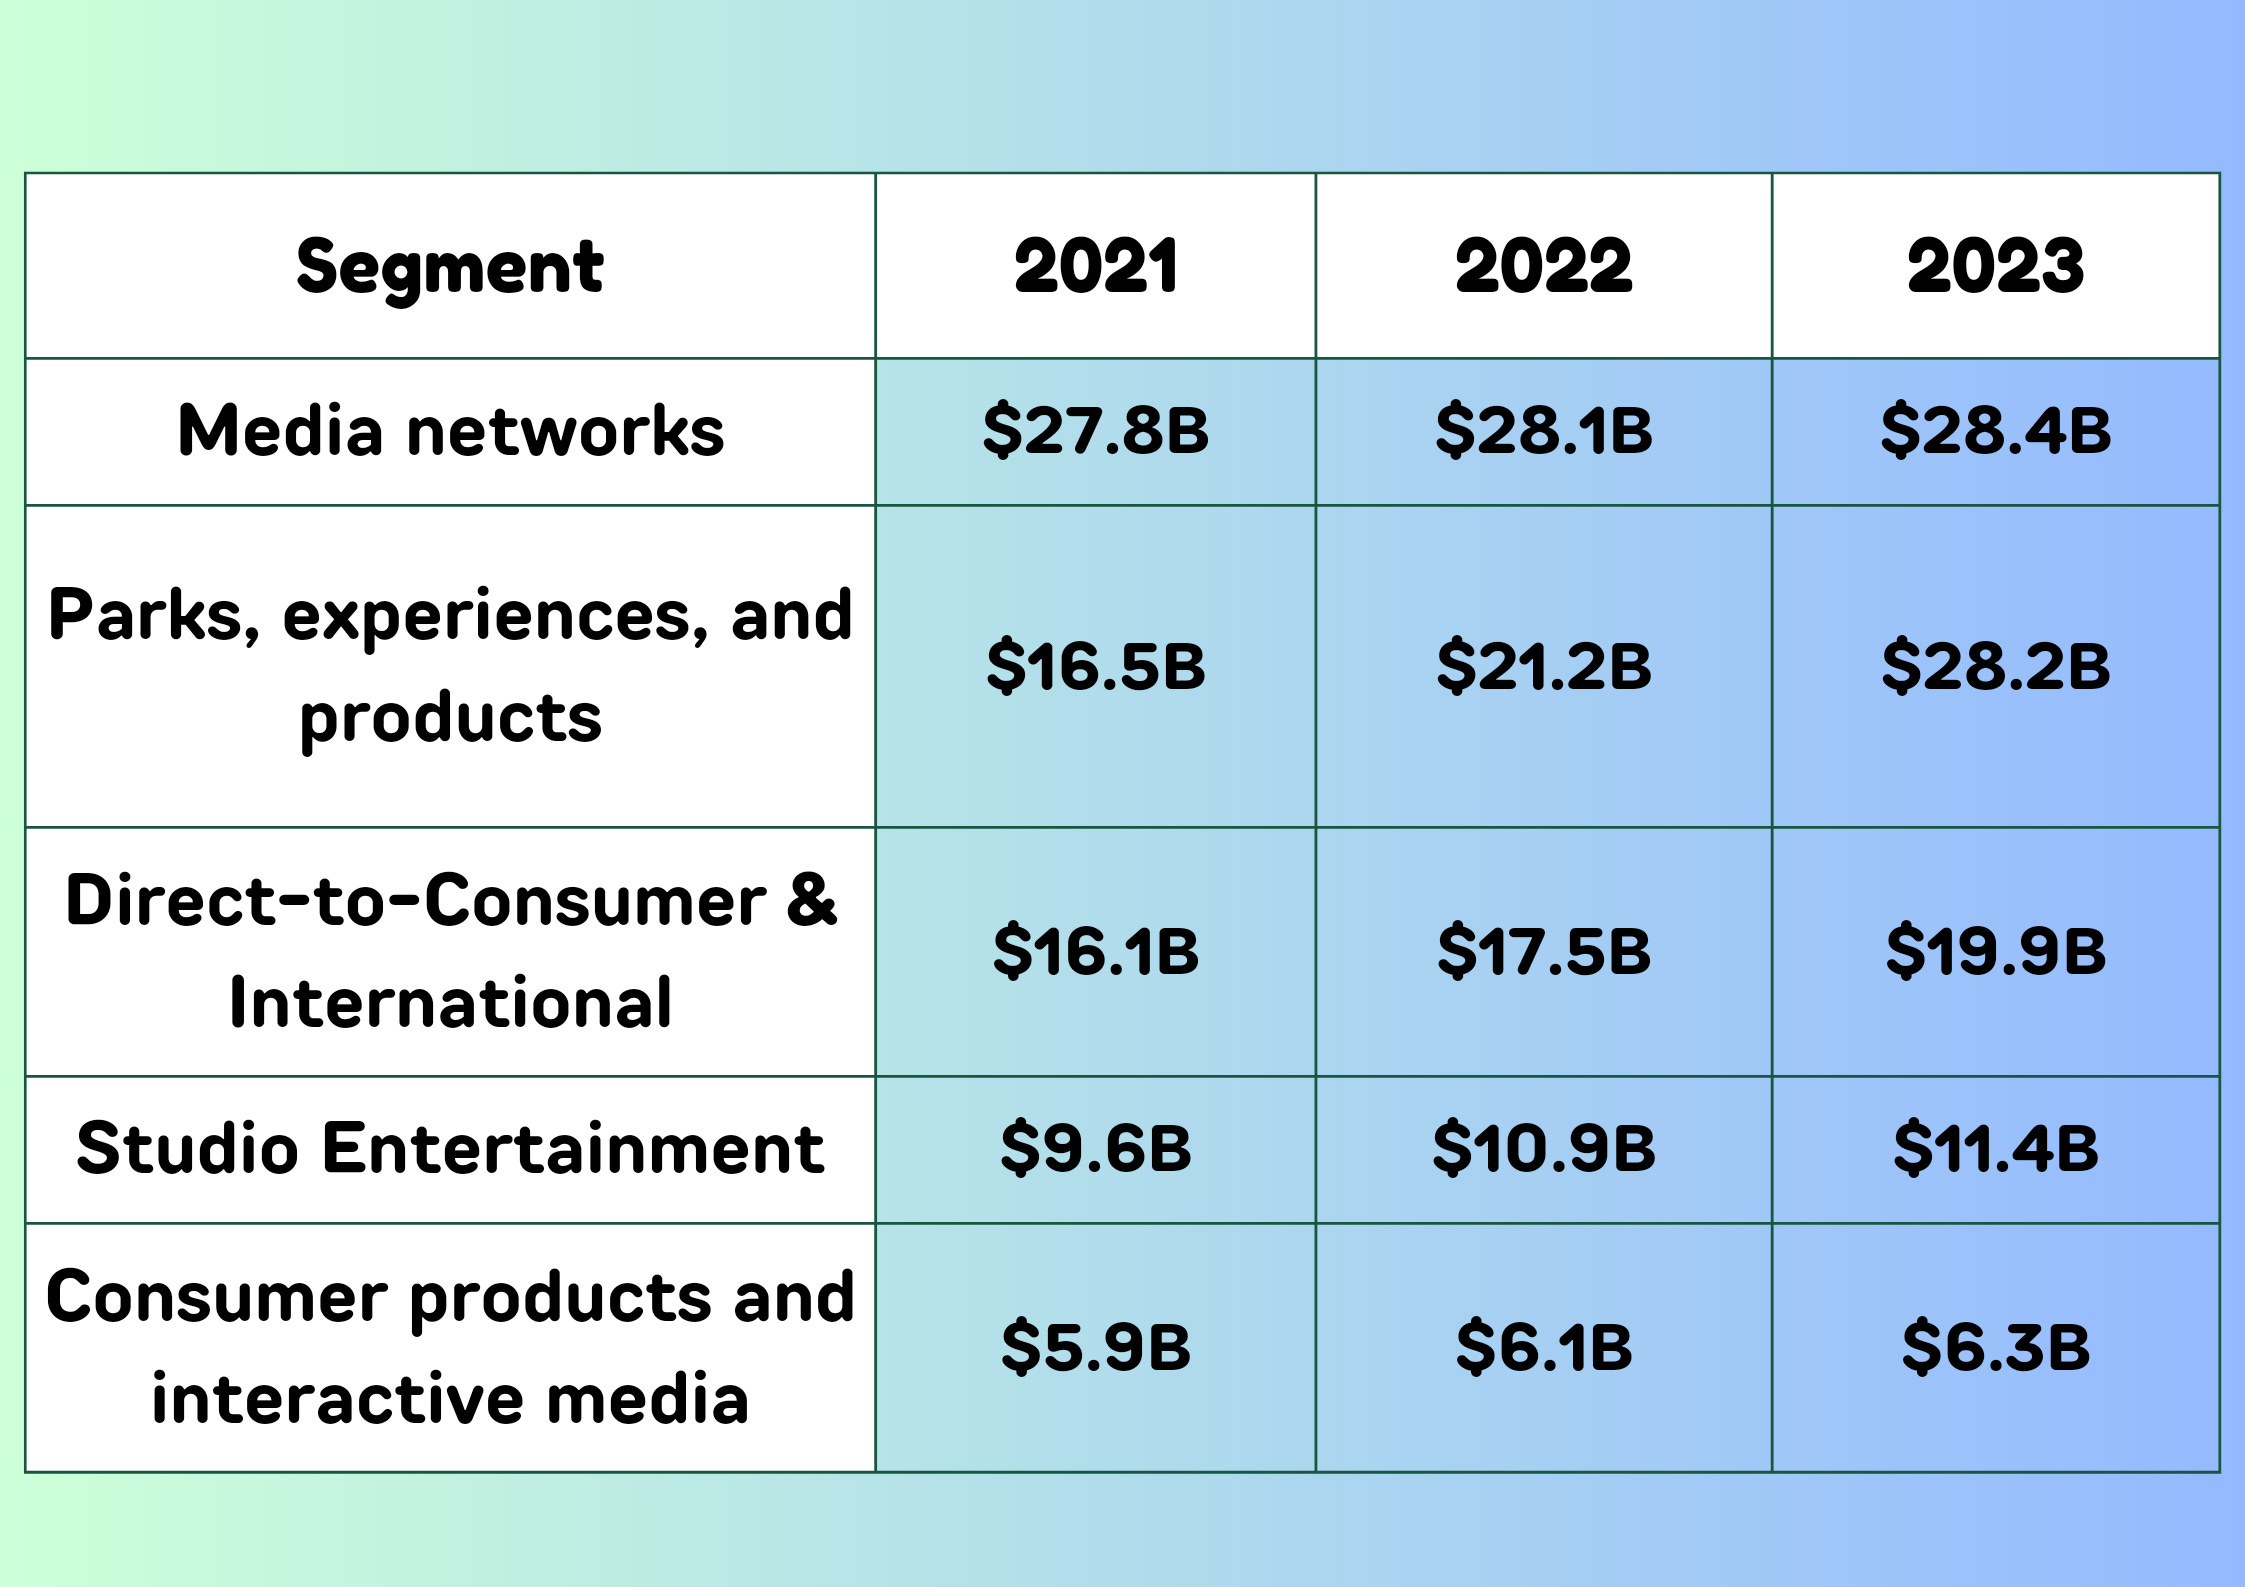
Year-on-Year Comparison of Disney's Revenue For The Past Three Years
Disney’s Cost Structure
Here are Disney's main cost components and their approximate percentages based on industry norms and the company's financial statements:
Content Preoduction and Acquisition: 30-35%
This includes the costs associated with producing movies, TV shows, and acquiring content for its streaming services.
Operating Expenses for Parks and Resorts: 25-30%
These costs encompass maintenance, operations, employee wages, and other associated expenses for Disney’s theme parks and resorts.
Marketing and Advertising: 10-15%
Disney invests significantly in promoting its movies, shows, parks, and products worldwide.
Technology and Infrastructure: 5-10%
Includes investments in IT infrastructure, streaming platforms, and technological innovations.
General and Administrative Expenses: 10-15%
These are the overhead costs related to corporate operations, including salaries of executives and administrative staff.
Cost of Goods Sold (COGS) for Merchandise: 5-10%
These costs are associated with producing and distributing Disney-branded merchandise.
Return on Investment (ROI)
Return on 2023 net income and total equity:
Net Income (2023): $3.145 billion
Total Equity (2023): $93.011 billion
ROI= (Net Income/(Total Equity) × 100
ROI= (3.145 billion/93.011 billion) × 100
ROI≈ 3.38%
Cash Flow Projections for The Next 5 years

*Assumptions for Projections
Operating Cash Flow Growth: based on historical growth rates and expected increase in revenue from streaming services and park operations.
Investing Cash Flow: includes capital expenditures for new content, park expansions, and technology investments.
Financing Cash Flow: accounts for debt repayments, dividend payments, and potential stock buybacks.
Recent Significant Financial Events at the co.
In recent years, The Walt Disney Company has experienced several important financial events:
2017: Acquisition of 21st Century Fox
In December 2017, Disney announced a $71.3 billion deal to acquire 21st Century Fox. This acquisition was finalized in March 2019, bringing valuable assets such as the 20th Century Fox film and TV studios, FX Networks, and National Geographic under Disney's umbrella.
2019: Launch of Disney+
In November 2019, Disney launched its streaming service, Disney+. The service quickly became a major player in the streaming industry, reaching over 100 million subscribers by early 2021. This move was pivotal in Disney’s shift toward direct-to-consumer entertainment.
2020: COVID-19 Pandemic Impact
The COVID-19 pandemic significantly impacted Disney's financial performance, especially in its theme parks, experiences, and products segment. Parks were closed for extended periods, and film releases were delayed or moved to streaming platforms. Despite these challenges, Disney+ continued to grow rapidly.
2021: Reorganization and Focus on Streaming
In October 2020, Disney announced a major reorganization to focus more on its streaming services. This included the creation of a new Media and Entertainment Distribution group, emphasizing content creation for streaming platforms.
2021: Record Performance of Disney+
By the end of 2021, Disney+ had exceeded 118 million subscribers, driven by popular content such as "The Mandalorian," Marvel series, and Pixar films. This contributed significantly to Disney's overall revenue growth.
2022: Return of Bob Iger as CEO
In November 2022, Disney announced that Bob Chapek would step down as CEO and that Bob Iger, who had previously led the company to great success, would return as CEO. This move aimed to stabilize the company and refocus on its core strengths.
2023: Continued Expansion and Financial Adjustments
Disney continued to expand its streaming services and announced several new projects and partnerships to enhance its content library. The company also implemented cost-cutting measures to improve profitability, including restructuring efforts and job cuts.
2024: Investment in Technology and New Ventures
In 2024, Disney announced significant investments in technology to enhance its streaming platforms and theme park experiences. The company also explored new ventures, including immersive experiences and interactive content, to stay ahead of industry trends.
Key Financial Metrics and Performance
Revenue Growth: despite challenges, Disney’s revenue from streaming services and media networks showed significant growth, helping offset declines in other segments.
Stock Performance: Disney’s stock has seen fluctuations, reflecting broader market trends and the company’s strategic shifts.
Profit Margins: the company focused on improving profit margins through operational efficiencies and strategic investments in high-growth areas like streaming and technology.
M&A History
The Walt Disney Company has a long history of mergers and acquisitions (M&A) that have significantly shaped its growth and evolution. Here's a detailed list of notable M&A activities from its inception to the present, including details about each acquisition, the purchase price, and whether it was ultimately profitable:
Early Acquisitions (Pre-1990s)
ABC Television Network (1995)
From: Capital Cities/ABC Inc.
Price: $19 billion
Profitability: Profitable. This acquisition helped Disney expand into broadcasting and cable television, significantly increasing its media footprint.
Major Acquisitions (1990s-2000s)
ESPN (1996)
From: Included in the ABC acquisition.
Price: Part of the $19 billion ABC deal
Profitability: Highly profitable. ESPN has been a major revenue driver through sports broadcasting rights and advertising.
Pixar Animation Studios (2006)
From: Steve Jobs and other shareholders
Price: $7.4 billion (in an all-stock deal)
Profitability: Profitable. Pixar's creative success rejuvenated Disney's animation department with hits like "Toy Story," "Finding Nemo," and "Up."
Marvel Entertainment (2009)
From: Marvel shareholders
Price: $4 billion
Profitability: Highly profitable. Marvel's characters have generated significant revenue through movies, merchandise, and theme park attractions. Films like "The Avengers" and "Black Panther" were massive box office successes.
Major Acquisitions (2010s-2020s)
Lucasfilm (2012)
From: George Lucas
Price: $4.05 billion
Profitability: Profitable. The acquisition brought the "Star Wars" franchise to Disney, leading to successful films, merchandise, and theme park attractions.
21st Century Fox (2019)
From: 21st Century Fox shareholders
Price: $71.3 billion
Profitability: Mixed. While the acquisition expanded Disney's content library and streaming capabilities, it has also been a significant financial burden, with some challenges in integrating the assets.
BAMTech (Majority Stake 2017)
From: MLB Advanced Media
Price: $2.58 billion (for 75% stake)
Profitability: Profitable. BAMTech technology has been crucial in the successful launch and operation of Disney+.
Recent Acquisitions (2020s)
20th Century Fox (as part of 21st Century Fox acquisition)
Profitability: Mixed. Added valuable content to Disney's portfolio but faced challenges in box office performance and integration.
Fox Networks Group (as part of 21st Century Fox acquisition)
Profitability: Mixed. Provided additional TV network assets, though some required restructuring.
Minor and Strategic Acquisitions
Miramax Films (1993)
From: Harvey and Bob Weinstein
Price: $60 million
Profitability: Profitable. Helped Disney release a number of successful films, although Disney sold Miramax in 2010.
Club Penguin (2007)
From: New Horizon Interactive
Price: $350 million
Profitability: Mixed. Initially popular but eventually shut down due to declining user engagement.
Playdom (2010)
From: Private investors
Price: $563.2 million
Profitability: Mixed. Acquired to boost Disney's social gaming presence, but didn't achieve long-term success.
To summarize the profitability of the above deals:
Highly Profitable: Pixar, Marvel, Lucasfilm, ESPN
Profitable: ABC, BAMTech, Miramax
Mixed Results: 21st Century Fox, Playdom, Club Penguin
Disney’s strategic acquisitions have generally been profitable, particularly those involving major content creators and technology platforms. These acquisitions have played a critical role in expanding Disney's media empire and diversifying its revenue streams. However, some large deals like 21st Century Fox have presented integration challenges and financial burdens despite adding valuable assets to Disney’s portfolio.
Current Disney Brands
The Walt Disney Company owns a vast portfolio of brands across various segments, including media networks, parks and resorts, studio entertainment, and direct-to-consumer services. Here's a list of the major Disney brands and their contribution to the company's revenue:
Media Networks
ABC Television Network
ESPN
Disney Channel
National Geographic
FX Networks
Freeform
Parks, experiences, and products
Disneyland Resort
Walt Disney World Resort
Disney Cruise Line
Disney Vacation Club
Adventures by Disney
Aulani, A Disney Resort & Spa
Studio Entertainment
Walt Disney Pictures
Pixar Animation Studios
Marvel Studios
Lucasfilm
20th Century Studios
Searchlight Pictures
Direct-to-Consumer & International
Disney+
Hulu
ESPN+
Star+ (in international markets)
Revenue Contribution by Segment
As of the most recent fiscal year, here is an approximate breakdown of how much each segment contributes to Disney’s overall revenue, which can be used to infer the contribution of the major brands within those segments:
Media Networks: 33%
Major contributors: ABC, ESPN, Disney Channel, FX Networks
Parks, Experiences, and Products: 37%
Major contributors: Disneyland Resort, Walt Disney World Resort, Disney Cruise Line
Studio Entertainment: 20%
Major contributors: Walt Disney Pictures, Pixar, Marvel, Lucasfilm, 20th Century Studios
Direct-to-Consumer & International: 15%
Major contributors: Disney+, Hulu, ESPN+, Star+
Breakdown by Major Brands
Given the above segments and their contributions, we can estimate the impact of some key brands within those segments:
Media Networks (33% of total revenue)
ABC Television Network: Approximately 10%
ESPN: Approximately 15%
Disney Channel: Approximately 3%
National Geographic, FX Networks, Freeform: Approximately 5%
Parks, Experiences, and Products (37% of total revenue)
Disneyland Resort: Approximately 12%
Walt Disney World Resort: Approximately 18%
Disney Cruise Line, Disney Vacation Club, Adventures by Disney, Aulani: Approximately 7%
Studio Entertainment (20% of total revenue)
Walt Disney Pictures: Approximately 5%
Pixar Animation Studios: Approximately 3%
Marvel Studios: Approximately 6%
Lucasfilm: Approximately 4%
20th Century Studios, Searchlight Pictures: Approximately 2%
Direct-to-Consumer & International (15% of total revenue)
Disney+: Approximately 10%
Hulu: Approximately 3%
ESPN+: Approximately 1%
Star+: Approximately 1%
Disclaimer: The information above is not by any means, a financial/investment advice.